This method identified “Active Cores” using active transportation data, and excluded “Exurban Areas” using low population density per kilometre and extensive automobile use. The remaining suburbs were classified into two groups (Transit Suburbs and Auto Suburbs) based upon the actual mode of transportation people use in order to get to work. This information was taken from 2021, 2016, 2006 and 1996 census data at the census tract level.
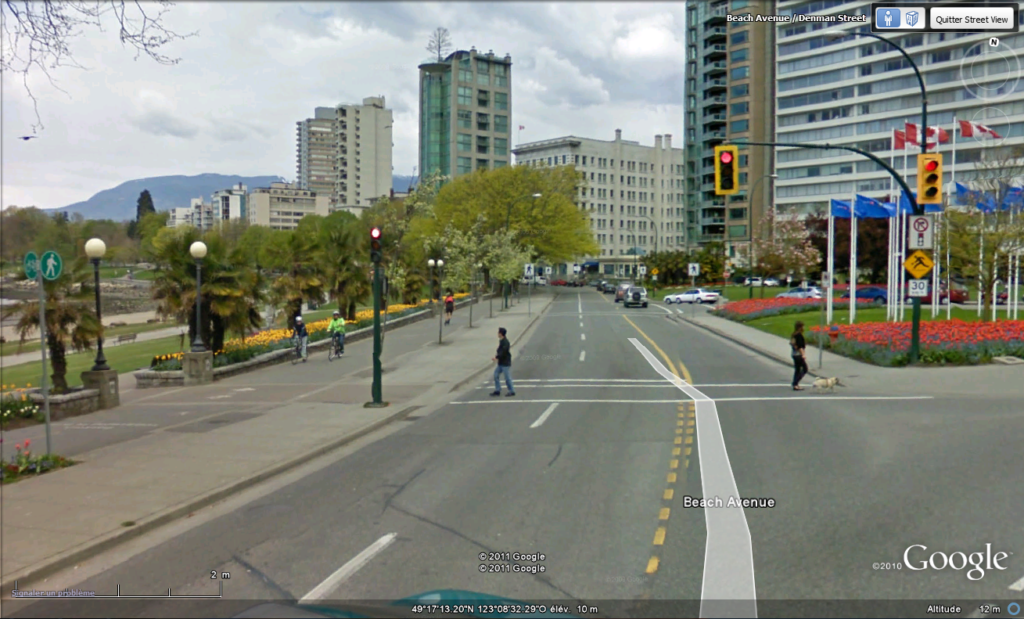
An Active Core is defined as a neighbourhood that has an average rate of active transportation, walking and cycling, 1.5 times higher than the overall average for the census metropolitan area. These census tracts are generally in central areas and the downtowns of cities. In some larger cities, Active Cores have begun to form in secondary centres outside of the downtown, such as Vancouver. In larger metropolitan areas, multiple Active Cores may also be older downtowns of towns that have now been absorbed into the larger CMA, such as St. Jerome in Montreal, Oakville in Toronto or Kitchener Waterloo and Cambridge. This is the reason for the designation of ‘Active Core’ as opposed to ‘Inner City. The results show that characteristics of the inner city may not simply occur in the geographic connotations of the term.
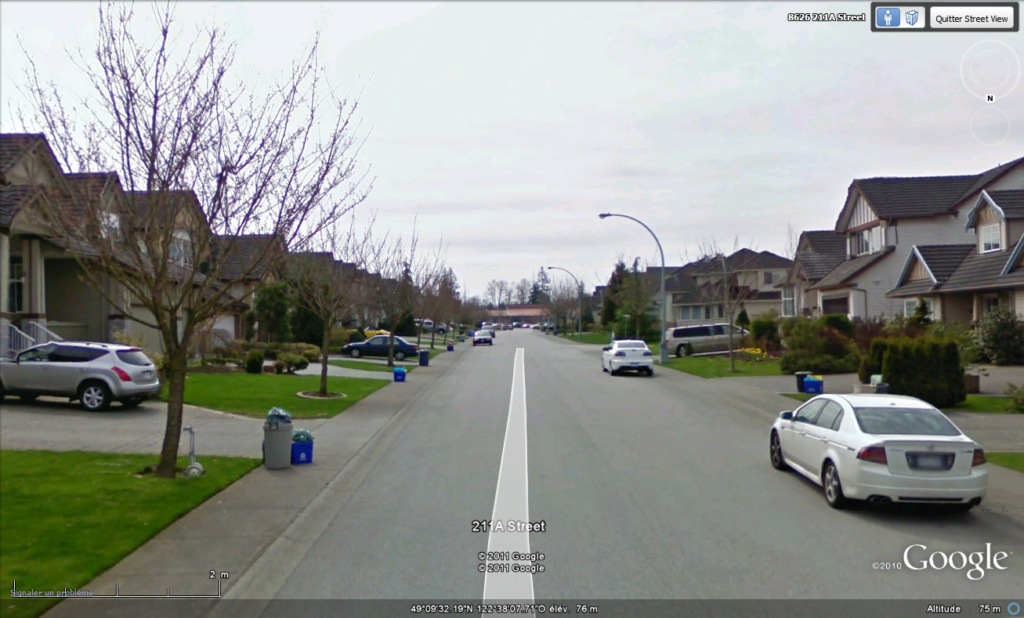
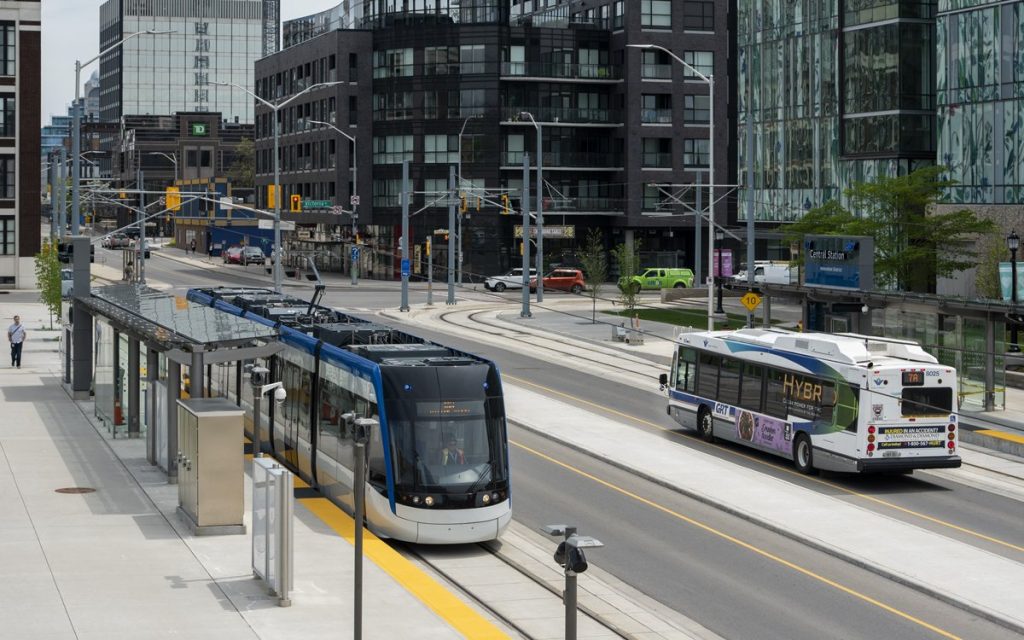
Suburbs are defined as areas with low active transit and generally have a high rate of automobile use. Although this chart simply shows the total suburbs, a second chart separates the suburb category into ‘Transit Suburbs’ and ‘Auto Suburbs’. ‘Transit Suburbs’ are census tracts that have a higher than average rate of transit use than the overall average for the CMA. This is relative because even if a census tract exceeds the average, transit use rates usually are fairly low in most Canadian cities. This effect is predominant in smaller CMAs and less in larger ones. ‘Automobile Suburbs’ consist of very low transit use rates and the automobile is the dominant mode of transportation.
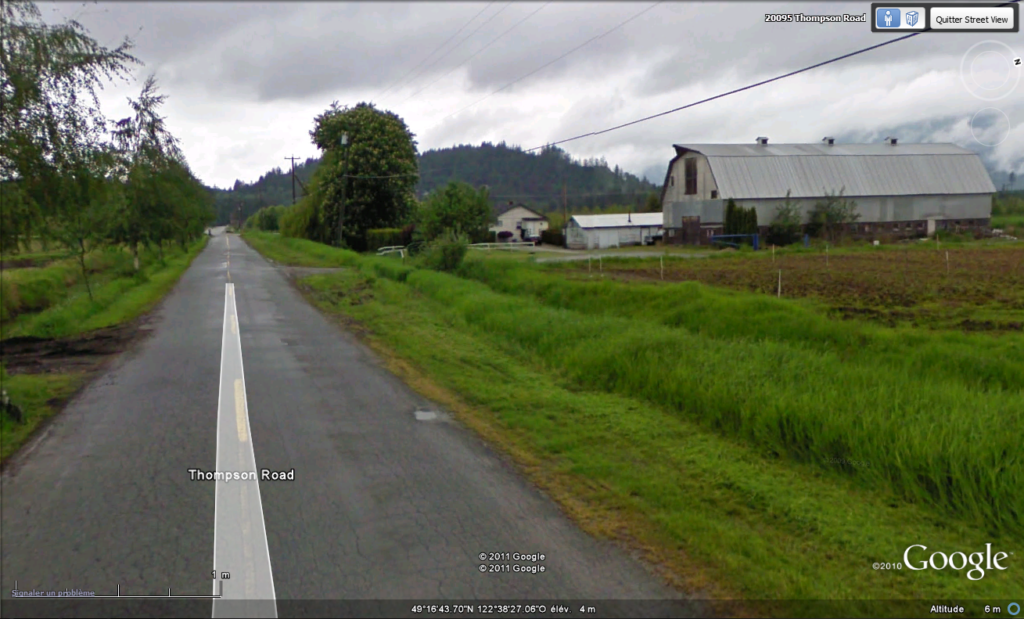
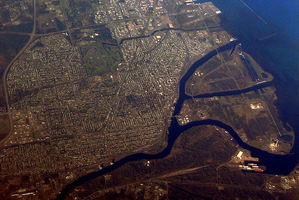
‘Exurban’ is defined as areas that have low density and mostly depend on automobile use. Though ‘Exurban’ is not included in the suburban category, many people may live in single detached homes and commute by auto to the Central City, as opposed to living a more agrarian lifestyle. We tried three different definitions of ‘low density’ for rural/exurban and settled on the Organization of Economic Co-operation and Development (OECD)’s rural communities definition, which is limited to areas that have less than 150 people per square kilometre. This is one of the methods used by Statistics Canada in their rural lands analysis (du Plessis et al, 2001).
We tried a dozen different models that used transportation and density measures in an attempt to classify the active core, suburbs and exurban areas. This chart shows the summary results for other models that were tried.
The density method uses the definitions of “Active Core” and “Exurban” areas from the Transportation Method.
An Active Core is defined as a neighbourhood that has an average rate of active transportation, walking and cycling, 1.5 times higher than the overall average for the census metropolitan area. These census tracts are generally in central areas and the downtowns of cities. In some larger cities, Active Cores have begun to form in secondary centres outside of the downtown, such as Vancouver.
In larger metropolitan areas, multiple Active Cores may also be older downtowns of towns that have now been absorbed into the larger CMA, such as St. Jerome in Montreal, Oakville in Toronto or Kitchener Waterloo and Cambridge. This is the reason for the designation of ‘Active Core’ as opposed to ‘Inner City’. The results show that characteristics of the inner city may not simply occur in the geographic connotations of the term.
‘Exurban’ is defined as areas that have low density and mostly depend on automobile use. Though ‘Exurban’ is not included in the suburban category, many people may live in single detached homes and commute by auto to the Central City, as opposed to living a more agrarian lifestyle. We tried three different definitions of ‘low density’ for rural/exurban and settled on the Organization of Economic Co-operation and Development (OECD)’s rural communities definition, which is limited to areas that have less than 150 people per square kilometre. This is one of the methods used by Statistics Canada in their rural lands analysis (du Plessis et al, 2001).
The difference lies with the classification of the suburban areas. Instead of transport behaviour, census tract are classified by their potential for transit use based on population density. Four density models were tested, based upon criteria from classic transit planning literature (Pushkarev & Zupan, 1977), which are still used as a threshold for transit use today (Victoria Transit Policy Institute, 2010). From the various definitions, the two suburb classifications have been: ‘Transit Supportive Suburb’ and ‘Auto Suburb’. ‘Transit Supportive Suburbs’ require a gross residential density greater than 17 units per hectare, which is considered an intermediate level of bus transit service. Auto Suburbs, while sharing the same name from the Transportation method are defined by a threshold of fewer than 17 units per hectare in this method.
However, even though this method only considered the gross density to support intermediate service (17 uph), few Canadian neighbourhoods have the density to justify this designation. This led to some strange comparisons with the Transportation Method because many neighbourhoods with some transit use did not appear to have the minimum density levels for economic bus service. This analysis may contribute to the discussion about why most Canadian transit services lose money. However, we decided to use the Transportation Method to classify suburbs because it is based upon people’s actual behaviour in taking transit to work, rather than a more abstract measure of potential for transit use. Nonetheless, some of the Density Method maps are included for major cities so these comparisons can be made.
The previous research team tried many different models based upon built form to classify suburban neighbourhoods. A pilot study of the Ottawa-Gatineau CMA was used to test various models, with the results checked by Google Earth and Google Street View.
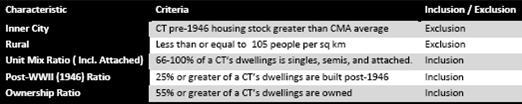
‘Inner City’ neighbourhoods were identified using Professor David Ley’s definition (2006). Census tracts that had higher than the metropolitan area’s population of houses built before 1946. This method had been used in other studies, but pre-1946 buildings have become less reliable methods to identify inner-city neighbourhoods as new construction occurs and brownfield redevelopment has been completed in large Canadian cities.
‘Rural’ neighbourhoods are classified as census tracts with a population density of fewer than 105 people per square kilometre based upon a previous research study (Ohio University, 2002). This has subsequently been updated to a Statistics Canada article for the Transportation Method and Density Method Rural (Exurban) definitions.
The remaining suburban neighbourhoods were identified by a combination of age of housing, proportion of singles, semi and attached units, and home ownerships ratios.
We produced a 2006 classification that matched the Ottawa air photos interpretation, but this definition was not useful for earlier census years or for other cities. Many Canadian cities have apartments or townhouses in their outer suburbs, such as Kanata or Orleans in Ottawa. These units confound a classification system based upon built form. A built form definition that gave reasonable results in Ottawa might produce a classification that made little sense in other cities.
After eighteen months of experimentation, the research team switched to models based upon transportation methods, which immediately produced more credible results.
Some Examples:
These maps show the dominant method of getting to work for the residents for each census tract. The data was retrieved from the 2006 census and organized into the following categories.
Active Transportation — Walking or cycling to work
Transit — Public transit or taxi
Automobile — Driving or passenger in car automobile
A census tract was classified as Active Transportation if more than 50% of the residents walked or cycled to work. Other combinations were plotted, such as Active Transport and Transit, the sum of these categories was 50%. Most census tracts were dominated by automobile travel. Transit-dominated neighborhoods tended to be in the inner suburbs, close to transit stations.
Some Examples:
We tried a dozen different models that used transportation and density measures in an attempt to classify the active core, suburbs, and exurban areas. This chart shows the summary results for other models that were tried.
We also tried to classify suburbs by using the built form and urban morphology. This method did not give credible results for most cities. For some sample maps, see here.
For an explanation of why this built form method did not work well, please see this paper.
Statistics Canada also tried a classification based upon built form and distance from the Central Business District. See Martin Turcotte’s article “The City/Suburb Contrast: How Can We Measure It ?”